Example CARE Impact Output
The following IMPACT that compares Alcohol Crashes (red bars) vs. Non-Alcohol (blue bars) for the Day of the Week variable will be used to explain IMPACT outputs
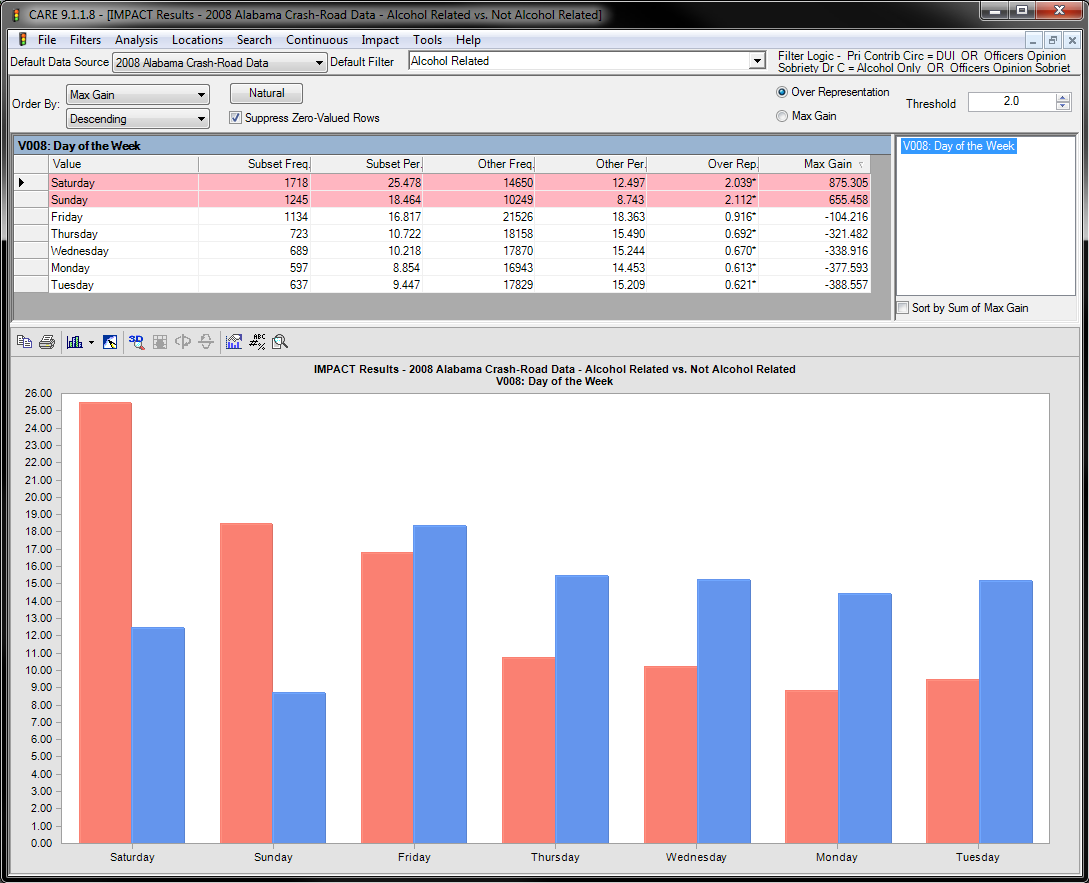
See image below for the IMPACT output for the alcohol-related day of the week variable will be used for this explanation. The left (red) bars represent the current subset (Alcohol Related/DUI Crashes for this example), while the right (blue) bars represent the proportion of crashes that are in the subset being compared (in this case the compliment, which is all crashes for which non-DUI causation was reported).
Note the largest Max Gain first output lists the “worst first” – all other things being equal. The first two numeric columns of the chart give the frequency and percentage for the subset (as defined by the current filter). In this case, the subset is alcohol-related crashes. So, Alabama had 1,718 alcohol crashes on Saturday for this particular time period, which were 25.478% of its total alcohol crashes. This is compared against the “Other” subset, which in this case is the non-alcohol crashes. This indicates that 14,650 non-alcohol crashes occurred on Saturday, which is 12.497% of all non-alcohol crashes.
To determine if there is an over-representation of alcohol crashes on Saturday, the proportions must be compared. In this example, 25.478/12.497 = 2.039, which is to say that there are more than twice the number of crashes that would typically be expected if Saturday alcohol crashes were the same as Saturday non-alcohol crashes. Note that the double bar chart for Saturday shows the same thing visually. A statistical test is performed, and the asterisk (*) on the 2.039* indicates that this is significant at the 99% level according to a statistical t-test that assumes a normal approximation of the binomial distribution. Statistical tests are not performed (no asterisk will ever appear) if either of the sample sizes used to compute the proportions (percentages) are less than 20.
Finally, the Max Gain (Maximum Gain) is the number of crashes that would be saved if we could somehow eliminate the over-representation. The total number of these crashes is 875 – notice that this is over half of the 1,718 alcohol crashes that occurred on Saturday. All other things being equal, this over-representation gives a measure of the maximum gain that could be expected if we could eliminate the particular (in this case “Saturday”) problem.