Category: Analysis & Data

  • September 22nd, 2016

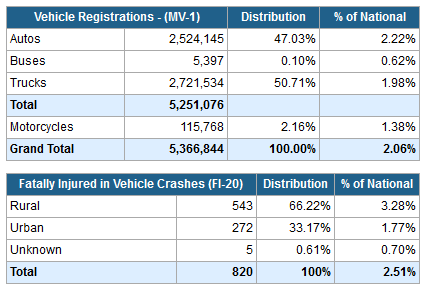
Vehicle Type Registrations – (MV1) Distribution % of National Autos 2,524,145 47.03% 2.22% Buses 5,397 0.10% 2.22% Trucks 2,721,534 50.71% 1.98% Total 5,251,076 Motorcycles 115,768 2.16% 1.38% Grand Total 5,366,844 100.00% 2.06% Area Fatally Injured in Vehicle Crashes (FI-20) Distribution % of National Rural 543 66.22% 3.28% Urban 272 33.17% 1.77% Unknown 5 0.61% .70% […]

  • September 15th, 2016

Highway express lanes provide a faster trip for carpoolers, people who drive low-emission cars, and solo travelers who are willing to pay more. That’s the idea, anyway. But as Americans drive more miles than ever before, express lanes are facing a challenge: they are too popular. So many drivers of all kinds are using the […]

  • September 9th, 2016

Passenger Travel Facts and Figures is a snapshot of the characteristics and trends of personal travel in the United States; the network over which passenger travel takes place; and the related economic, safety, and environmental aspects of passenger travel. An electronic version of this publication is available at www.bts.gov. Chapter 1 summarizes the basic demographic […]

  • September 4th, 2016

Motor vehicle travel is a major means of transportation in the United States, providing an unparalleled degree of mobility. Yet for all its advantages, motor vehicle crashes were the leading cause of death for age 11 and every age 16 through 24 in 2014.1 The mission of the National Highway Traffic Safety Administration is to […]

  • September 3rd, 2016

After growing steadily for several decades, passenger vehicle miles traveled (VMT) in the United States unexpectedly leveled off in the 2000s. The growth rate of VMT has since rebounded, and determining the factors that explain these developments has implications for future US oil consumption and greenhouse gas emissions. We show that changes in the demographic […]

  • August 11th, 2016

Based on the Non-Traffic Surveillance (NTS) system, an average of 1,898 people were killed each year in non-traffic motor vehicle crashes during the 3-year period 2012 to 2014. About a third (34%) of those people killed were nonoccupants such as pedestrians and bicyclists. Additionally, on an average, 92,000 people were injured in these crashes each […]